Monitoring and Evidence
Run the built-in checks against what your tools report, and keep the proof that each control operates.
Monitoring holds 195 built-in checks. Each one reads the resources your connections have already collected, gives every resource a verdict, and writes one result per run. You see which checks pass, which resources fail, how long they have been failing, and what changed since the last run.
Evidence is the library of proof. Every passing check files an artifact on its own. You add the rest: a file from your device, or a link to a hosted document. Each artifact is mapped to controls, has an owner, and has a renewal date after which it stops counting.
These two feed every readiness number in the product. A control blends the pass rate of the checks bound to it with the freshness of the evidence attached to it. Excluding a resource or letting an artifact expire moves those numbers.
Who uses this
Admin
Can run all the checks or one check, turn a check on or off, exclude and reinstate resources, map evidence to controls, set an owner and a renewal date, delete evidence, and create evidence requests and templates
Cannot change how a check decides, or create a custom check from any screen
Member
Can read every Monitoring and Evidence screen, upload a file or add a URL as evidence, mark a request assigned to them as fulfilled, and record a reviewer verdict on a control
Cannot run checks, exclude a resource, turn a check on or off, change an owner or a renewal date, delete evidence, or create requests
Approver
Can read everything a member reads, and add evidence
Cannot mark an evidence request fulfilled or record a reviewer verdict. Both are refused by the server
Auditor
Can open every screen here, read findings, exclusions and the reasons written on them, download evidence, and read the run history
Cannot change anything. Every run, upload, exclusion and AI review is refused
Outside party: none
Can nothing. No screen in this area is reachable from outside your organisation
Cannot see any of it. An external auditor is given an Auditor login and reads it from the inside
The screens
Monitoring
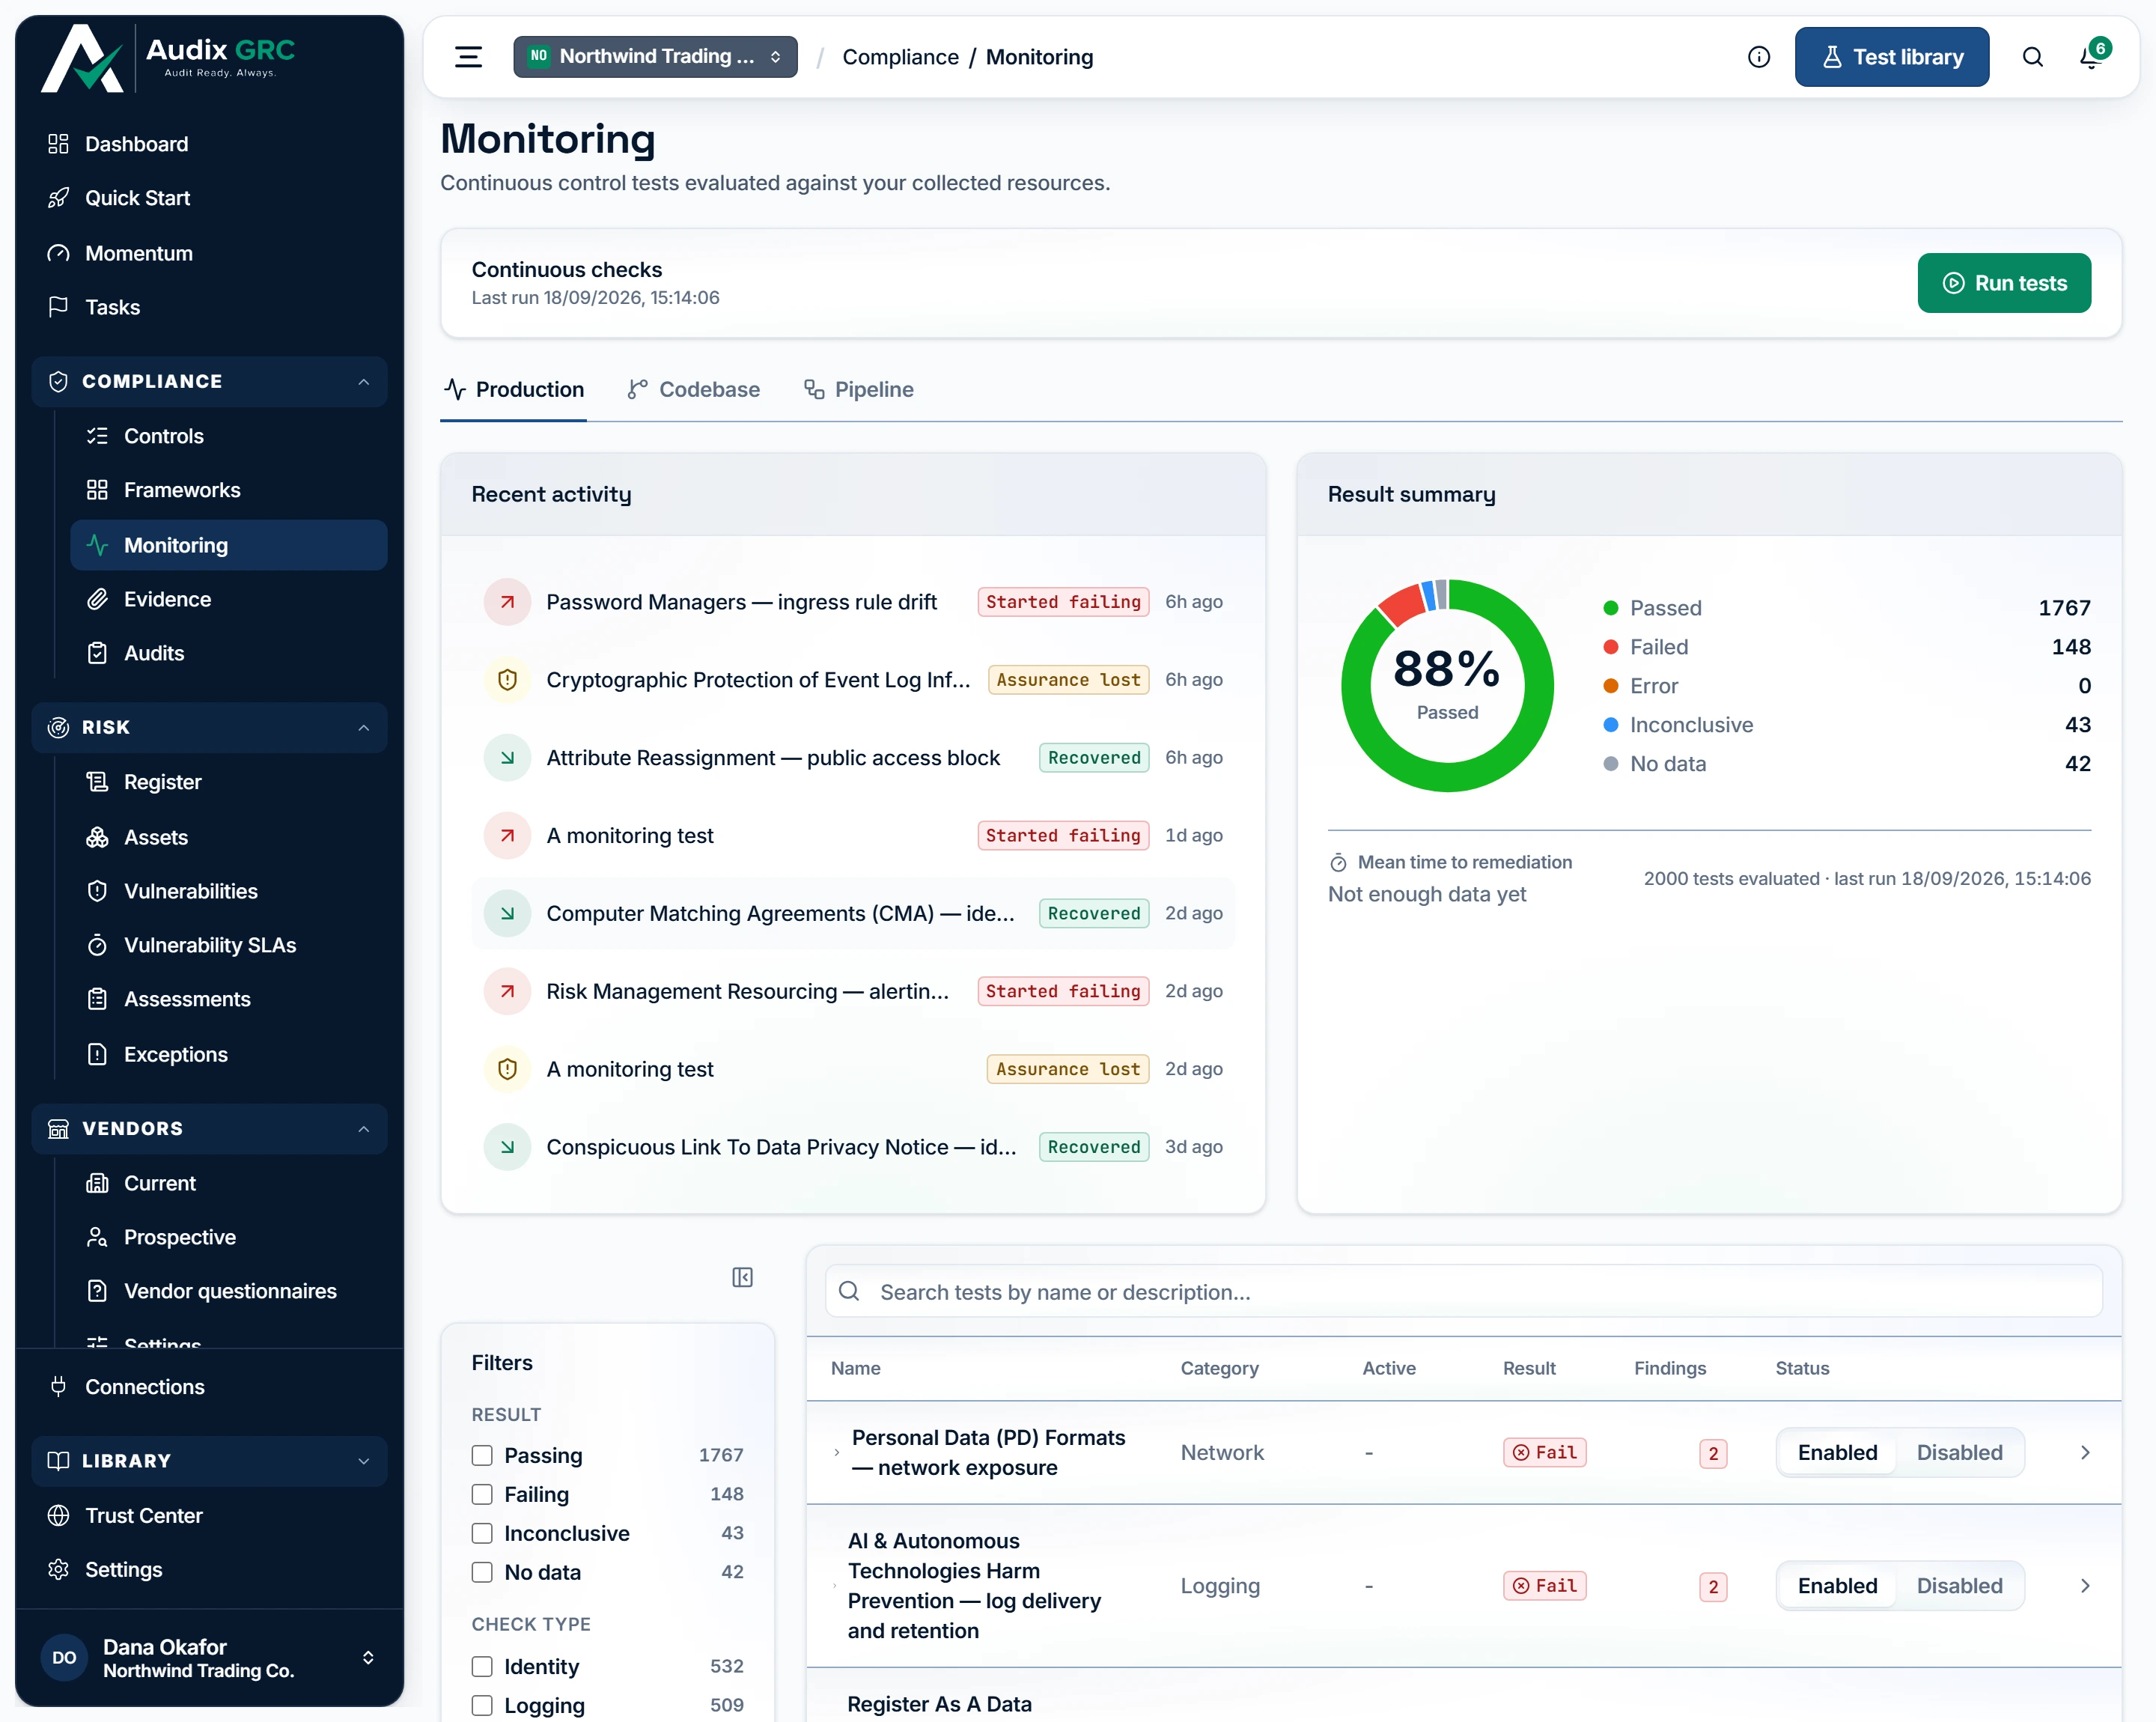
- When the checks last ran. Every enabled check is re-graded on a 24-hour schedule and after each connection sync, and an admin can start a run here without waiting.
- The whole catalogue. Opens every check the platform holds, including the ones no connected tool can feed yet.
- What changed, and when. A check that started failing, one that recovered, and one whose assurance was lost because it can no longer be evaluated at all.
- Take a check out. A disabled check keeps its history, its findings and its exclusions, but stops being graded and drops out of every count above.
What one run of the checks leaves behind
The latest verdict of every automated check, split into Production, Codebase and Pipeline, with recent activity and a result summary.
Check detail
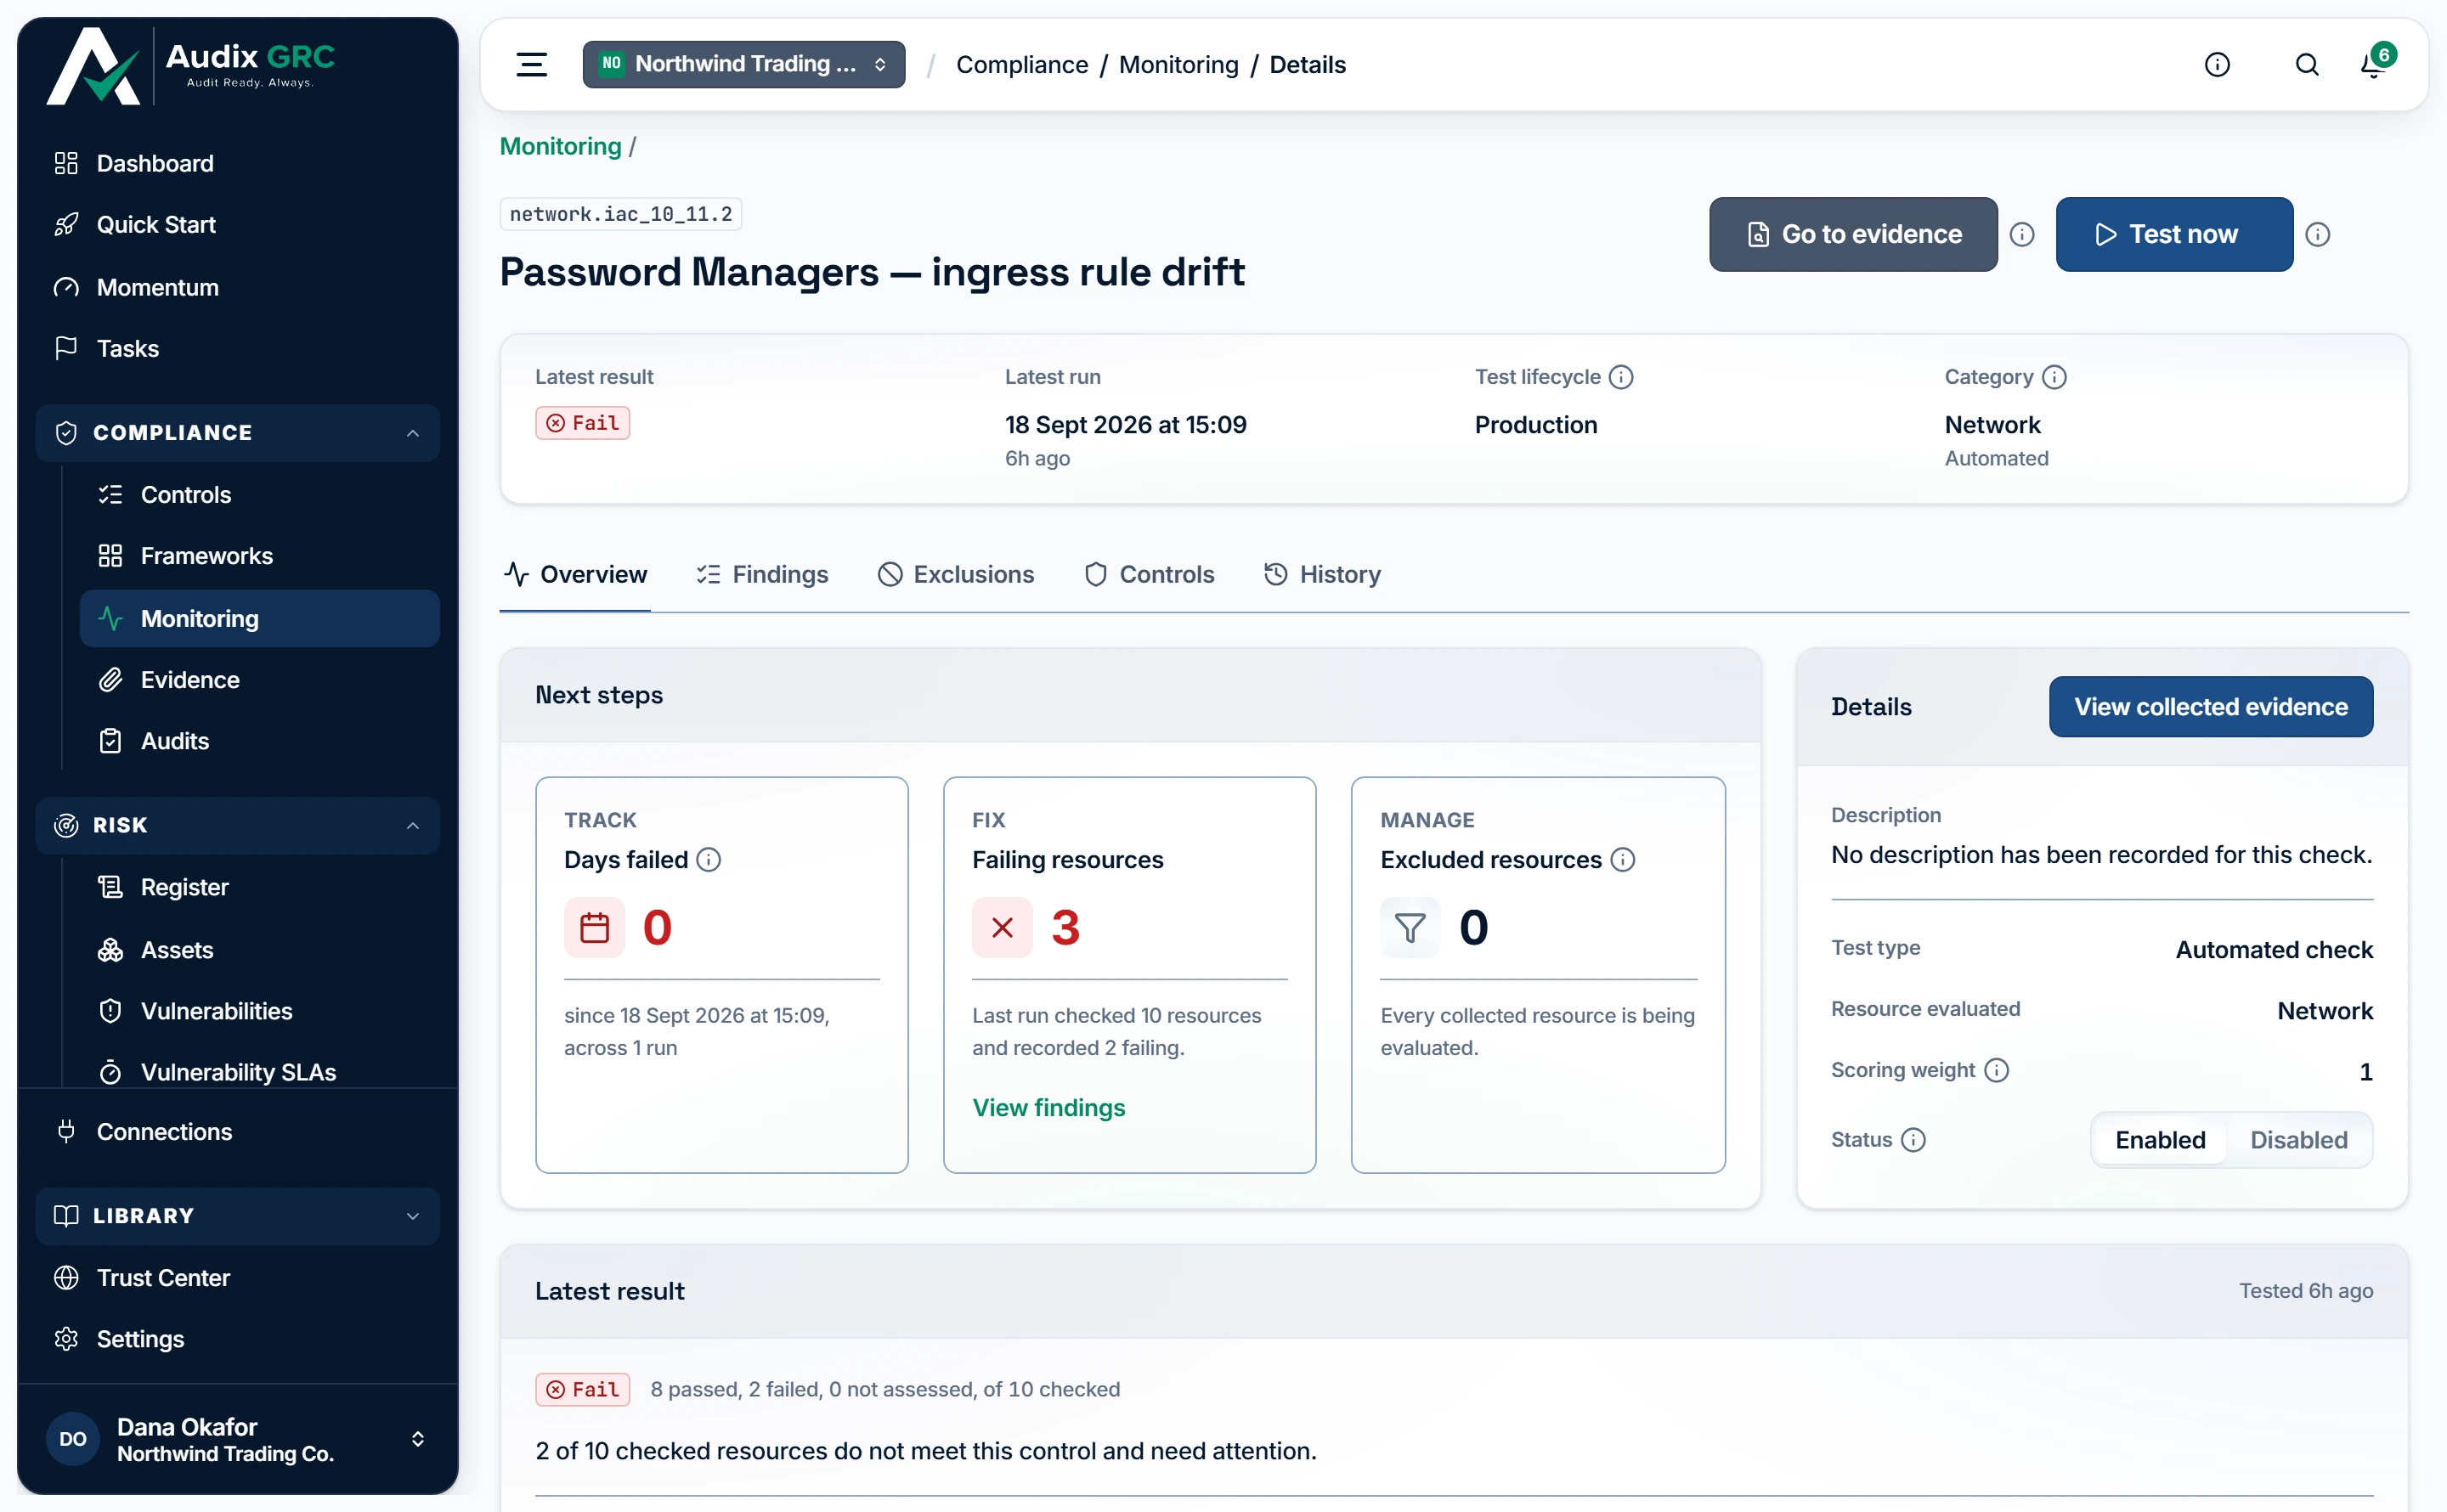
- Grade it again now. Re-runs this one check against the resources already collected and answers immediately, without fetching anything new or touching any other check.
- How long it has been wrong. The unbroken run of days since this check last changed verdict; zero means it only started failing today.
- Which resources are failing. Opens the list of individual buckets, repositories or security groups behind the count, which the next screen shows.
One check: what it found on the last run, the fix steps, the connections that power it, the controls it supports, and the record of what it looked at.
Findings
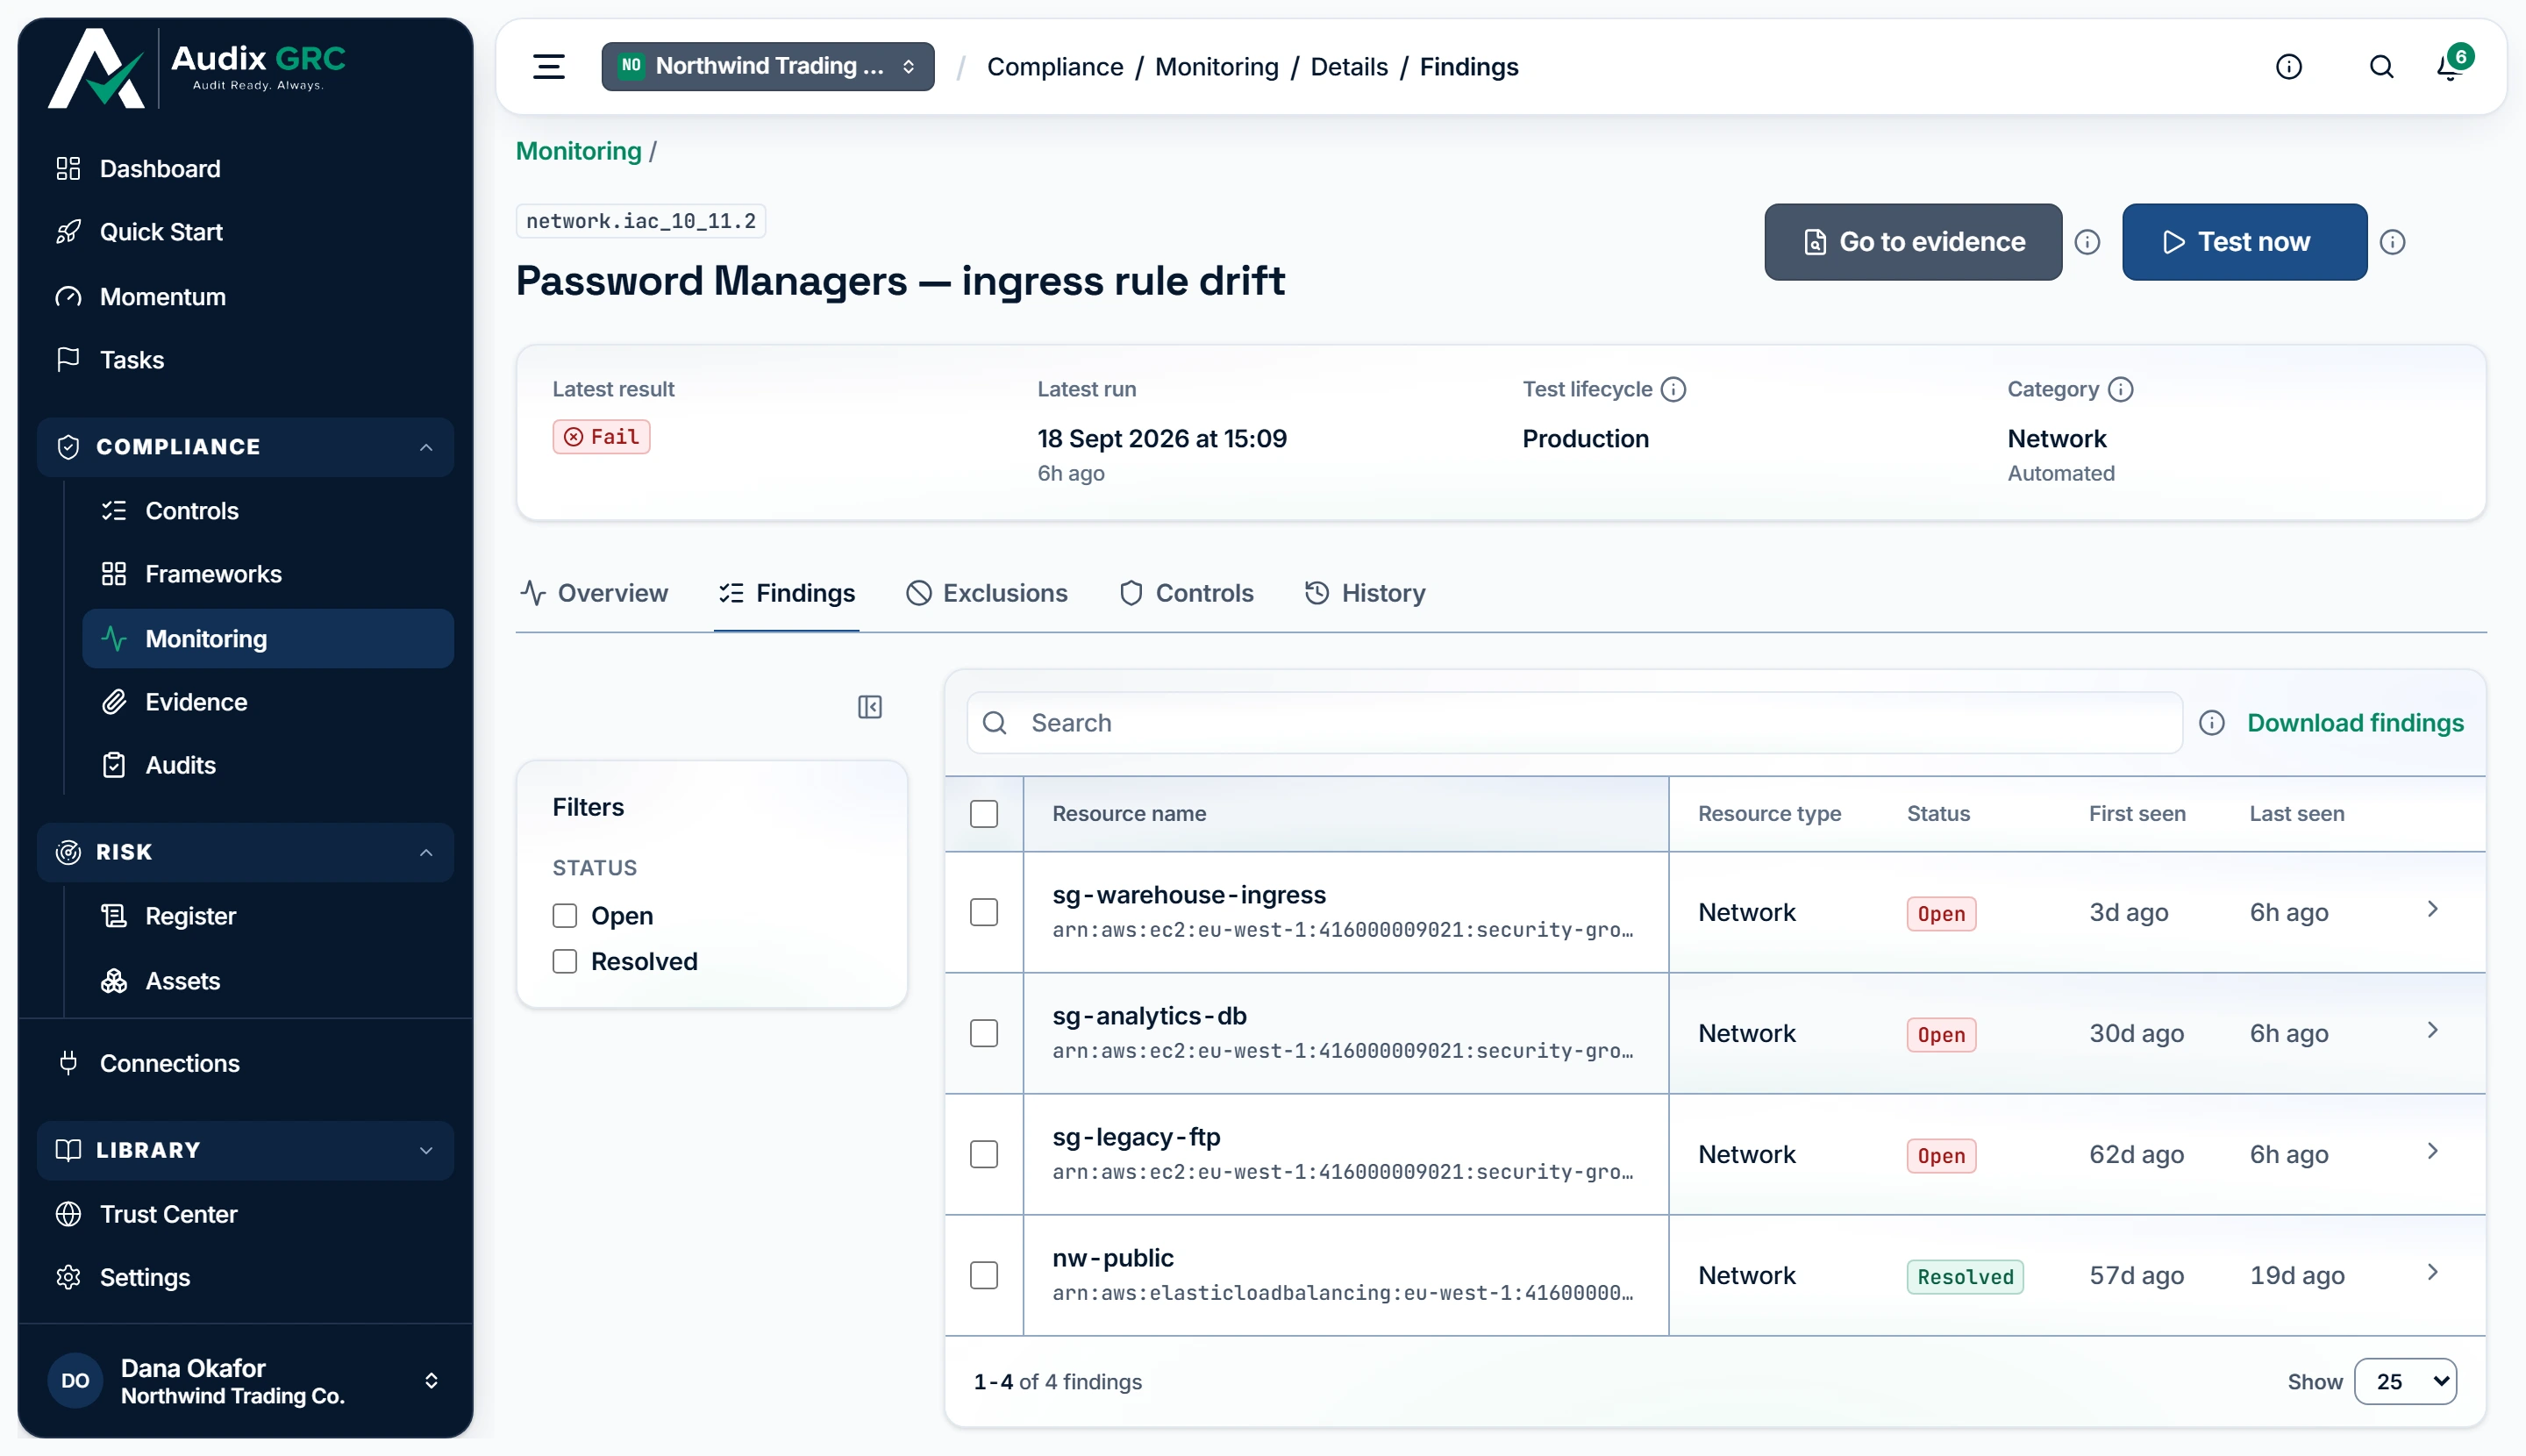
- Dated from the first failure. A finding belongs to the resource, not to the run, so it keeps the day it first failed instead of starting again at every evaluation.
- Closed without anyone closing it. A finding resolves itself once a later run no longer sees that resource failing, and reopens under its original date if it fails again.
Every resource that has ever failed this check, with its status and how long it has been failing.
Exclusions
Resources suppressed from this check, each with a written reason, who wrote it and when.
History
Twelve months of runs by outcome, the run log with the reason each run happened, and every time the check flipped.
Test library
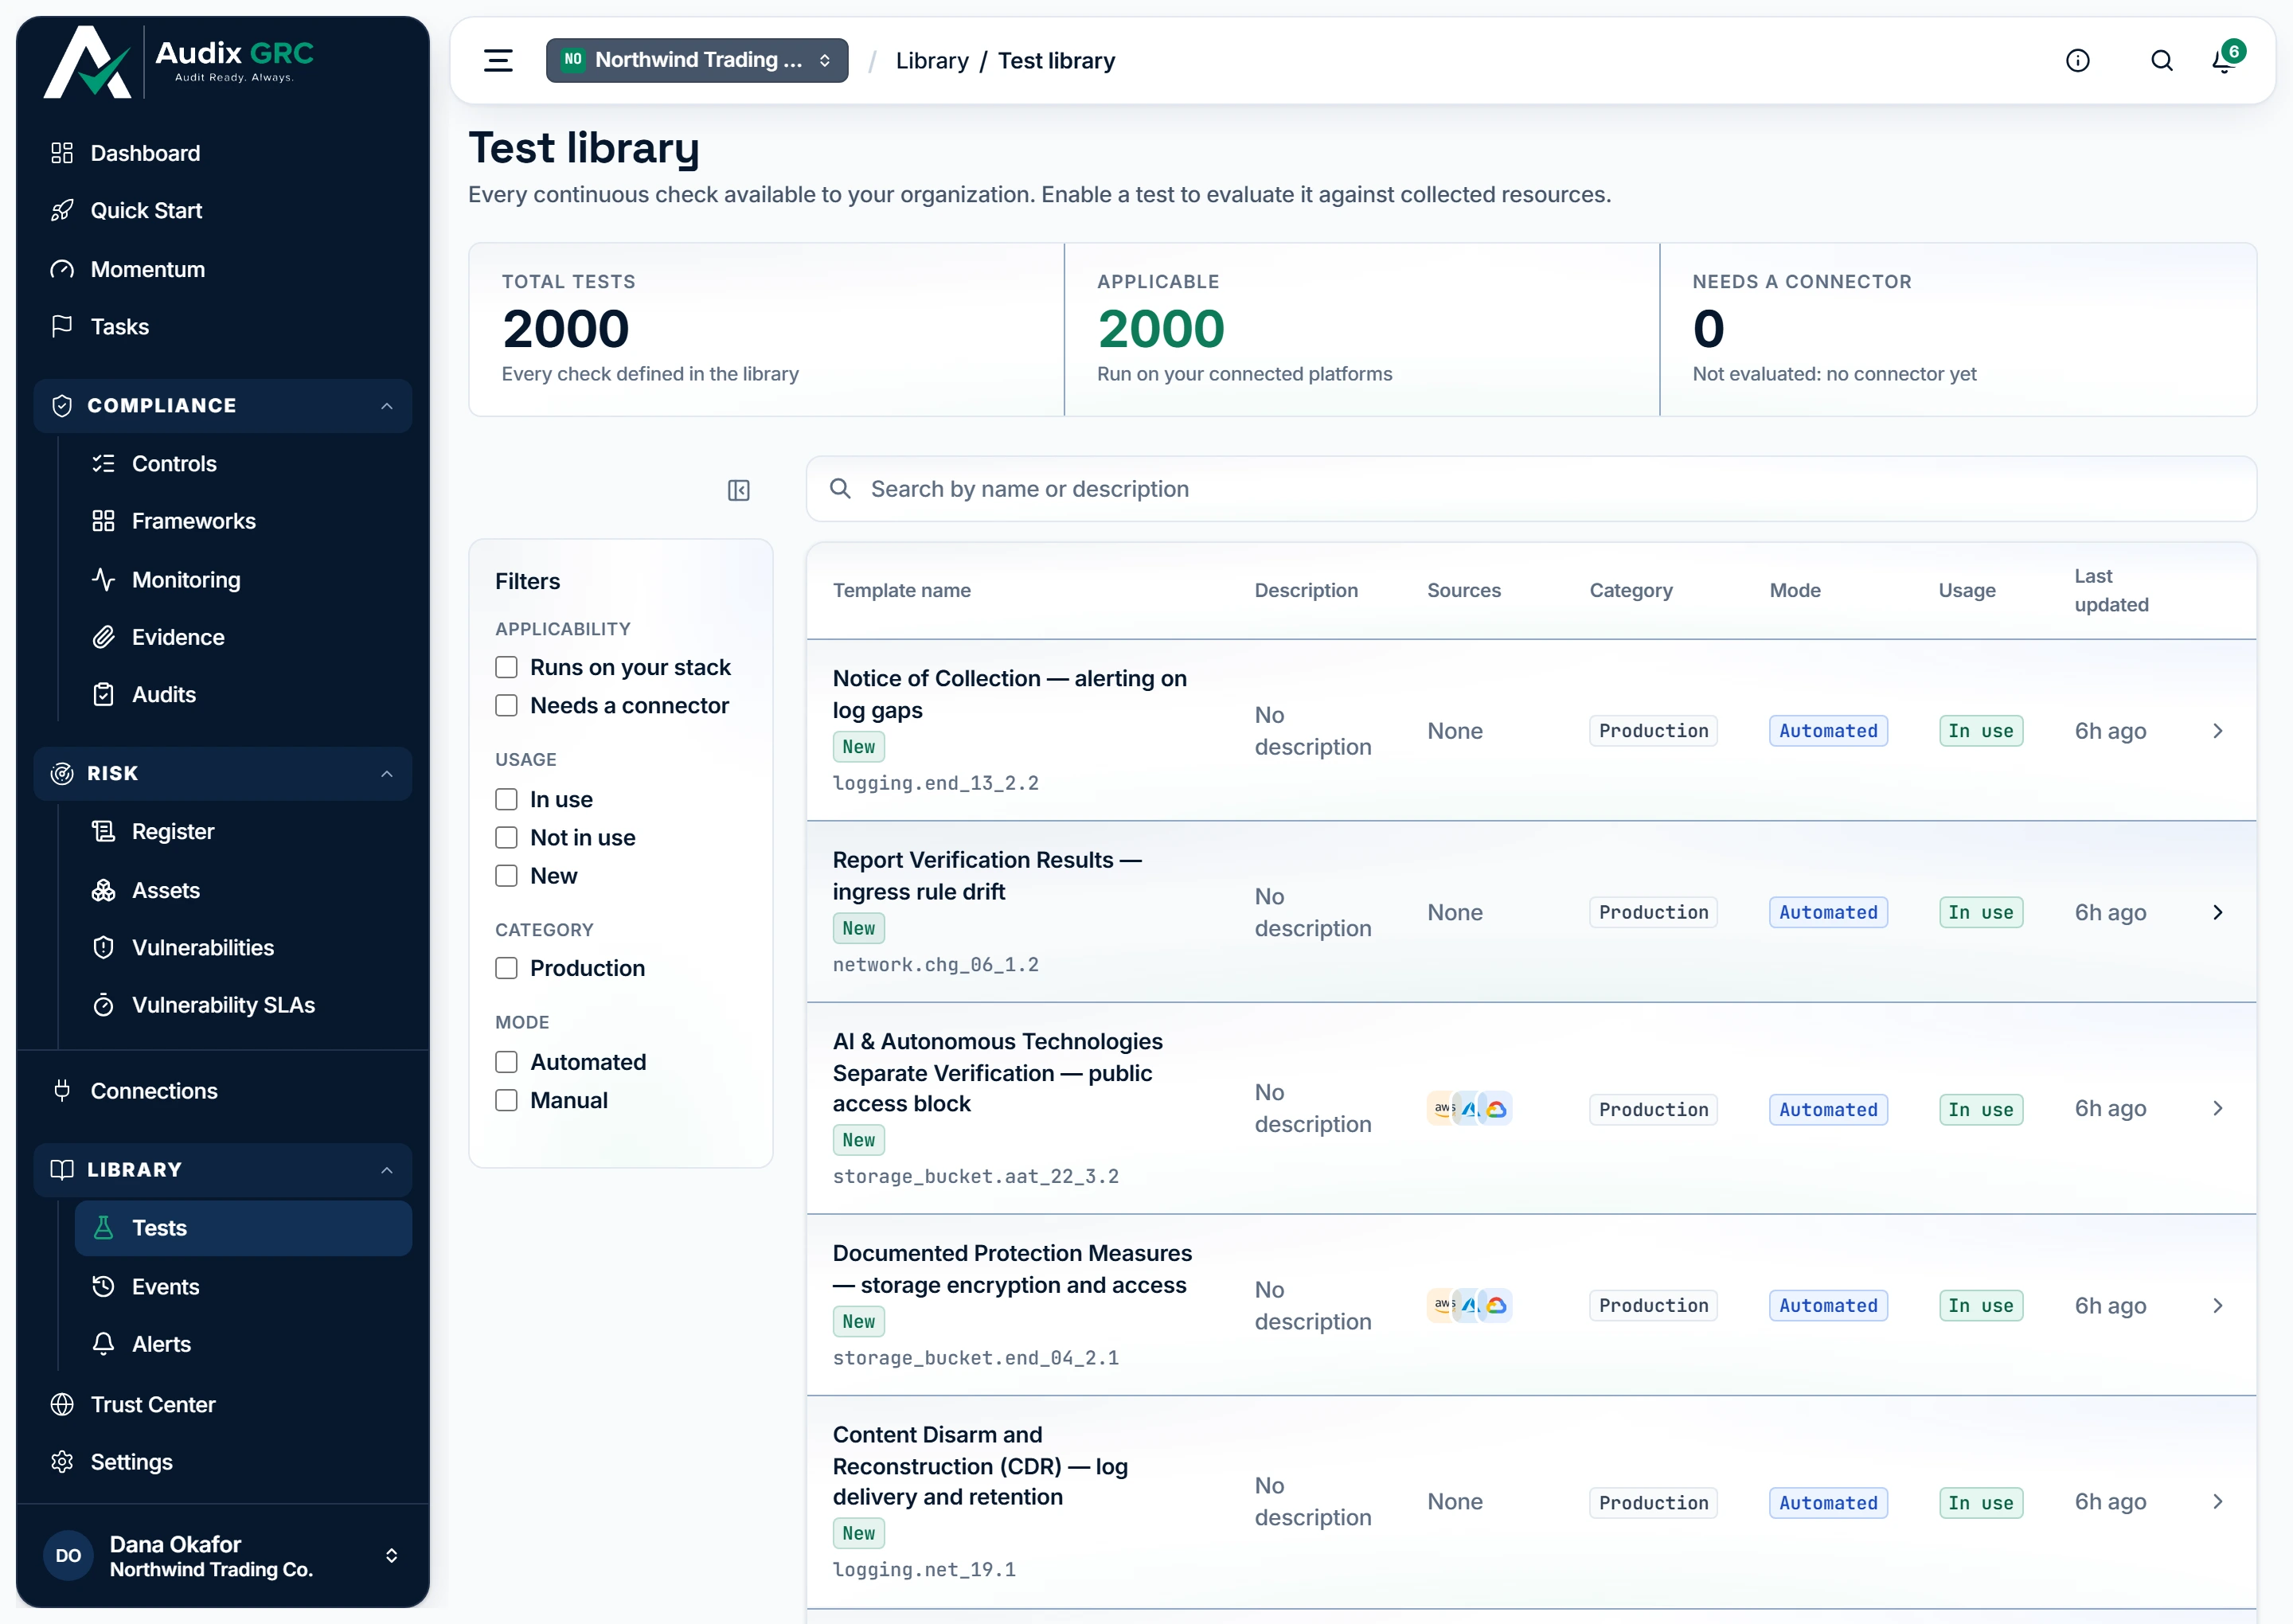
- What can actually run. A check is applicable only when a connected tool supplies the kind of resource it reads; the rest are listed but never evaluated, so nothing is quietly counted as passing.
- Find a check. Matches the name, the description, the resource type and the stable key printed under each name, which is what the platform calls the check everywhere else.
- Automated, or a person. Most checks read your connected tools on a schedule; a manual one is a verdict a named reviewer records on a control, for the things no connector can see.
Every check the platform holds, whether your connections can supply the data it needs, and whether it is in use.
Evidence
- Proof expires. Each artifact has a renewal date and an hourly sweep moves it on, so a control cannot stay green on a document nobody has looked at in a year.
- Where the proof came from. A file someone uploaded, a URL they linked, or an artifact a passing check filed on its own.
How an artifact arrives, and how it ages
Every artifact with its status, source, mapped controls and owner, and underneath it the open evidence requests.
Evidence detail
One artifact: a preview, its mapped controls, its freshness history, and the owner and renewal settings.
Tests (older page)
A pass donut and a plain results table that Monitoring replaced.
What you can do
Browse the check catalogueLive
See every check the platform can run, whether your connected tools can supply the data it needs, and whether the check is in use.
As a member
- Open Library, then Tests.
- Read the three tiles: Total tests, Applicable, which run on your connected platforms, and Needs a connector, which are not evaluated because nothing feeds them yet.
- Filter on Applicability, Usage, Category or Mode. Search matches the name, the description, the key and the resource type.
- Read a row: the name with its stable key underneath, such as
identity-mfa-enabled, a New pill when the check arrived in the last 30 days, the connector logos under Sources, the Category, the Mode and the Usage. - Click a row to open that check in Monitoring.
Rules that apply
- The catalogue is the same for every organisation. It is refreshed before every run, so a new check appears without anyone installing it.
- Turning a check on or off happens in Monitoring, not here.
- Manual reviewer checks are listed here with Mode Manual. They are created from a control page.
- A check bound to no control still runs. Its result moves no score.
See how every check is doingLive
One place for the latest verdict of every automated check, grouped by surface, with what changed recently.
As a member
- Open Compliance, then Monitoring. The Continuous checks bar at the top says when the checks last ran.
- Pick a tab: Production, Codebase or Pipeline. The tab is kept in the address, so you can share the view.
- On Production, Recent activity lists the last eight changes as Started failing, Recovered or Assurance lost. Result summary is a donut of Passed, Failed, Error, Inconclusive and No data, next to the mean time to remediation.
- The table lists every automated check with its category, the connectors that feed it, its result, its failing resource count and whether it is enabled. Sort any column, filter on the rail, or search.
- Click a row to expand it: a plain sentence such as "3 of 12 checked resources do not meet this control and need attention.", the failing resources, the stored record, and an AI review panel.
- Codebase repeats the table for repository checks. Pipeline is a read-only list of your GitHub workflow pipelines and their runs.
As an admin
- Same as a member, plus the Status cell becomes an Enabled and Disabled control you can click.
- Run tests works. See Run the checks.
- On the Pipeline tab, click Refresh from latest sync to rebuild the pipeline list from the most recent GitHub sync.
Rules that apply
- A disabled check stays in the table but is left out of the donut, the pass rate and the tiles.
- Rows are ordered failing first, then errored, then passing, so what needs attention is at the top.
- Manual reviewer checks are not in Monitoring. They are verdicts a person records, not continuous checks.
- Not applicable means no connected tool supplies that kind of resource. Hover the pill and it names the connectors that would.
- Mean time to remediation reads "Not enough data yet" until one check has failed and then passed again.
Run the checksLive
Grade the enabled checks against the resources your connections have already collected.
As a member
- The Run tests button is on screen for everyone, but pressing it as a member gives an error. Only an admin can start a run.
- While a run is going you can watch it. The bar updates every second and a half and says how many checks are done.
- Ask an admin to run the checks, or wait. They run on their own every 24 hours and after every connection sync.
As an admin
- Click Run tests in the Continuous checks bar. The run is queued for the whole organisation.
- The bar reads "Starting the run...", then "Evaluating 42 of 190 checks..." with a progress fill.
- When it finishes the page reloads and the toast reads "Tests finished; results and scores are updating".
- To grade one check on its own, open it and click Test now. It answers straight away, for example "This check failed. 15 of 18 resources graded, 3 excluded (0 passing, 15 failing)."
- Test now is disabled on a check that is turned off, and is not shown on a manual check.
Rules that apply
- Checks also run without anyone asking: once every 24 hours, after every connection sync, after an exclusion is added or removed, and after a reviewer records a verdict. The run log names which of these it was.
- Test now grades the resources already collected. It does not fetch anything new from the provider, and it does not touch your other checks.
- One run at a time per organisation. Pressing Run tests while a run is queued does not start a second one.
- A check with nothing to grade does not quietly pass. It reports No data and names what it needs, for example "Requires azure: not connected, so this check does not apply".
- A check the platform cannot evaluate records Error. It is never counted as a pass.
- Scoring treats a pass older than your organisation's result lifetime as stale, while Monitoring keeps showing the raw verdict. The two can disagree, by design.
Read one checkLive
Understand what a single check evaluates, what it found last time, and what to do about it.
As a member
- Click a check from Monitoring. The header carries its key, its name, a Disabled pill when it is off, and the meta strip: Latest result, Latest run, Test lifecycle and Category.
- Take action lists numbered fix steps. It appears only when the latest result is a failure.
- Next steps gives three tiles: how many days the current pass or fail streak has run, how many resources are failing with View findings, and how many are excluded with View exclusions.
- Latest result gives the counts, the plain sentence, and the failing resources.
- Supported connections lists the tools that can power this check, each with its state and its last sync time.
- Evidence from the last run shows the stored record, and What this run looked at lists each sampled resource, its verdict and the attributes the check read.
- Open the Controls tab to see which controls this check supports. Each one links to its control page.
- Click Run AI review for a second opinion on whether the stored evidence supports the result, with its confidence and its concerns.
As an admin
- Same as a member, plus Test now in the header and the Enabled and Disabled control inside Details.
Rules that apply
- A count the page could not read shows Not available, never 0.
- A run stores at most 25 resources, so a check with 40 failures says "Showing 25 of the 40 resources this run recorded as failing".
- What this run looked at says why a value is missing, for example "the check looked for it and this resource does not have it" or "the value is a list or an object, and its contents are deliberately not stored".
- The rule a check applies is not shown anywhere. The page tells you what the check found, not how it decides.
- Go to evidence opens the whole Evidence library. It cannot filter to one check.
Track which resources failLive
Keep a record per resource, so one failing bucket or repository can be followed over time instead of reappearing as a fresh problem every run.
As a member
- Open the Findings tab on a check.
- Read the table: resource name with its raw identifier, resource type, status, first seen and last seen. Filter on Status or Resource type, or search.
- Click Download findings for a CSV. It includes the exclusion reason where there is one.
- Click a row to open the drawer: the state in words, This resource over time with the continuous failing span and one column per run, How to fix this, What this check requires, Finding details and the Stored record.
- Use Previous and Next in the drawer to walk the list without closing it.
As an admin
- Same as a member, plus a tick box on every Open and Resolved row.
- Select rows and click Exclude in the bulk bar, or click Exclude this finding in the drawer. Both open the exclude dialog.
Rules that apply
- A finding belongs to a resource, not to a run. It keeps its first-seen date, so the drawer can say "14 days failed (continuous)".
- Findings are only reconciled when the check actually graded resources. A run that errored or found no data leaves the list as it was.
- Above a thousand findings on one check the page says "Showing the 1,000 most recent of N. Older findings are not loaded."
- A finding has no severity, no assignee and no owner. Those columns are left out rather than shown blank.
- The drawer's Not recorded section names what is deliberately not stored: region, connection, account and severity.
Exclude a resource from a checkLive
Declare that one resource is acceptable as it is, so it stops holding a check red, with a written reason an auditor can read.
As a member
- Open the Exclusions tab to read what has been excluded: the resource, the reason, who excluded it and when.
- Click Download exclusions for a CSV.
- You cannot add or remove one. The Findings tab tells you "Only an organization admin can exclude a resource from a check."
As an admin
- On the Findings tab, select the rows you want and click Exclude, or open a finding and click Exclude this finding.
- Read What excluding changes in the dialog. It warns that the check can turn from Failed to Passed and that the readiness reported to auditors can change.
- Write an Exclusion reason, up to 2,000 characters. It is required.
- Tick "I have confirmed these resources and understand this changes the readiness an auditor sees", then click Exclude N findings.
- The tab says "Re-running the checks so this list reflects the exclusion..." and reloads once the re-run lands.
- To reverse it, open the Exclusions tab, open the row menu and choose Put resource back into the check.
Rules that apply
- The reason is required on screen. It is visible to anyone who can open the check, auditors included, and it is not part of the audit export package.
- Every exclusion, and every reinstatement, re-runs every enabled check for the whole organisation, not only the check you were looking at.
- An exclusion has no approval, no expiry and no review. Any admin writes it and it stays until an admin removes it. A control exception is the reviewed, time-boxed version, and the risk register lists both side by side.
- The audit log records that an exclusion was added or removed. It does not record which resource, or the reason.
- Exclusions on a check that has been turned off stay on the list but suppress nothing while it is off.
- If part of a bulk exclusion fails, the result names which part, for example "2 of 3 excluded. These were not: ...".
Read a check's historyLive
See how a check has behaved over time and when it flipped.
As a member
- Open the History tab on a check.
- Results over time stacks twelve months of runs by outcome. The note underneath states what is covered, for example "Covers the most recent 500 of 1,212 recorded runs".
- Run history gives one row per run with the result, the counts, the trigger and how many resources were graded. Expand a row for the plain sentence and the stored record.
- Click Download the runs shown for a CSV of the runs on screen.
- Status changes lists Started failing, Returned to passing and Assurance lost.
Rules that apply
- Results are kept forever and never pruned.
- The Trigger column says why a run happened: manual, scheduled, sync, exclusion or attestation.
- A status change is only recorded from the second run onwards. The first run has nothing to compare against.
- Status changes reads your organisation's newest hundred entries, so older flips on a quiet check fall outside the window. The panel says so.
Turn a check offLive
Take a check out of the monitored set without losing what it has recorded.
As a member
- The Status cell in Monitoring and the Details card on a check show a read-only Enabled or Disabled pill.
As an admin
- In Monitoring, click the Enabled and Disabled control in the check's row. The same control sits in Details on the check page.
- The toast confirms it, for example "Public S3 buckets is disabled. It stops being evaluated and drops out of the monitored set."
- Turn it back on and it runs at the next evaluation.
Rules that apply
- A disabled check keeps its history, its findings and its exclusions. It stops being graded and drops out of every count and out of the donut.
- There is nowhere to record why a check was turned off, or who turned it off.
- Scores are recalculated when you turn a check on or off.
Record a reviewer verdictLive
Some controls no connector can check. A person records the verdict instead, and it counts towards the control the same way an automated result does.
As a member
- Open the control and find the Manual checks card.
- Click Pass or Fail on the named check, and add a note if it helps.
- The verdict is filed as a result on that check with your name against it, and the control's score is recalculated.
As an admin
- Same as a member, plus you can add a named manual check to a control and remove one.
Rules that apply
- Manual checks appear in the Test library with Mode Manual, and their own check page is marked Reviewer attested. They have no Test now button and never appear in Monitoring.
- The most recent verdict drives the control's test factor, the same as an automated pass or fail.
- An automated check cannot be attested, and a manual check cannot be run.
- An approver cannot record a verdict. The route accepts members and admins only.
Work through the evidence libraryLive
One list of every artifact that proves a control operates, with its freshness, its mapping and its owner visible at a glance.
As a member
- Open Compliance, then Evidence.
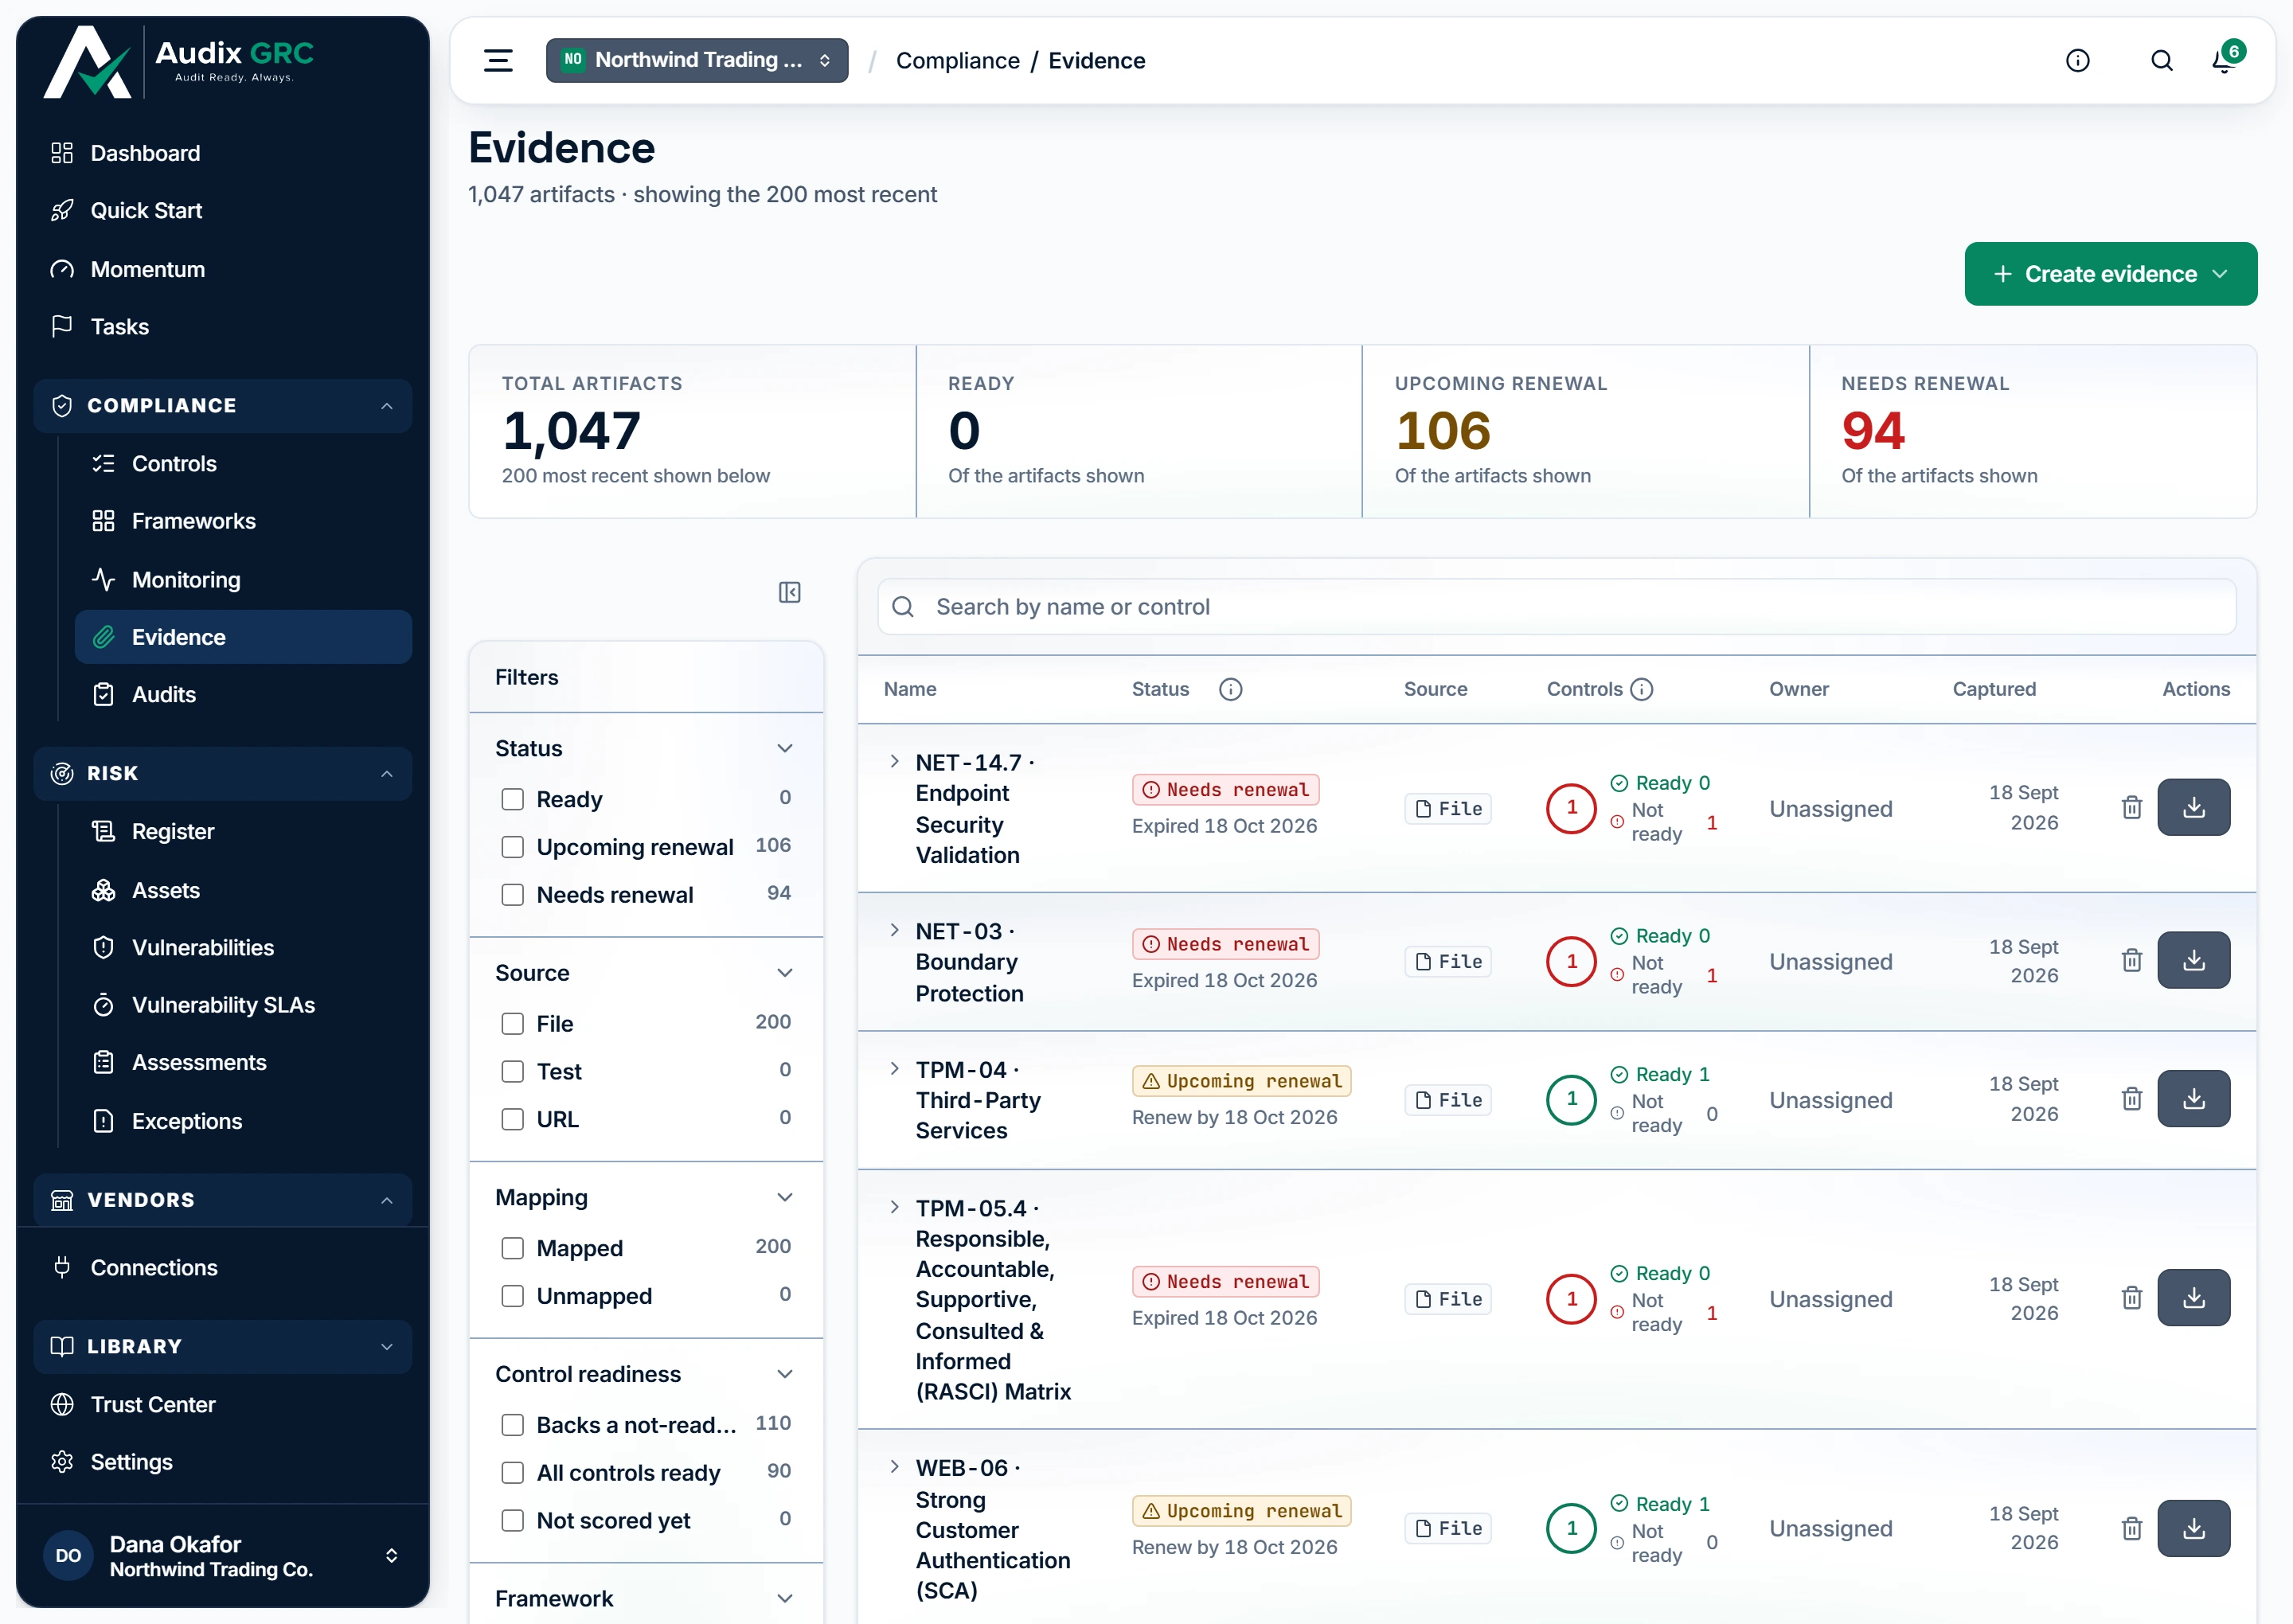
- Read the tiles: Total artifacts, Ready, Upcoming renewal and Needs renewal.
- Filter on the rail: Status, Source, Mapping, Control readiness and Framework. Search by name, content hash or control code.
- Read a row: the name, a status pill carrying its Valid until, Renew by or Expired date, a source chip of File, Test or URL, a Controls seal counting the mapped controls, the owner and the captured date.
- Click a row to expand Artifact preview. Text, CSV and JSON render inline, PDFs and images embed, anything else says "No inline preview for this file type. Use Download to open it."
- Click the download icon to get the file. It is decrypted as it is sent to you.
As an admin
- Same as a member, plus a trash icon on every row. It asks you to confirm before it deletes.
Rules that apply
- The library loads the 200 most recently collected artifacts. The Total artifacts tile is the true total, and anything past the cap is still reachable from its control page.
- The same file uploaded twice is stored once. The second upload adds a control link and nothing else.
- Only PDF, PNG, JPEG, GIF and WebP preview in the browser. Everything else has to be downloaded.
- Files are encrypted before they are stored, and each one is identified by a hash of its contents.
- The Controls seal is tinted by readiness. A control with no score yet is never counted as not ready.
Add your own evidenceLive
Attach proof for the controls no connector can check: a policy document, a signed form, a screenshot, a hosted page.
As a member
- On the Evidence page, click Create evidence and choose Upload file or Add URL evidence.
- For a file: choose or drop it, or paste a screenshot. Set a Title, a Freshness window (days), a Description, and pick the controls it proves under Map to controls. Click Upload evidence.
- For a URL: enter a public HTTPS address, a Title, a freshness window and a Description, then click Add URL evidence. Only the first control you pick is linked.
- From a control page you can skip the mapping step. Open the Evidence tab, use Add evidence, and the artifact is mapped to that control for you.
Rules that apply
- A file is limited to 5 MB.
- Scriptable file types are refused: "That file type is not accepted as evidence. Upload a document, image, or data export (PDF, PNG, CSV, JSON, ...)".
- A URL has to be public HTTPS. Internal addresses are refused. The link is stored, never a copy of the page, and nothing behind it is ever fetched.
- The freshness window defaults to 30 days.
- Uploading identical bytes again does not renew the artifact already there. Adding the same URL again does renew it.
- Every new artifact recalculates the scores of the controls it is mapped to.
Configure one artifactLive
Make one artifact count towards the right controls, give it an accountable owner, and set an honest renewal date.
As a member
- Open an artifact from the list, or click Open full details & configure on an expanded row.
- Read the meta strip, the Artifact preview, Mapped controls, Freshness history and the Overview card with the type, the size and the content hash.
- Click Download to get the file.
As an admin
- Under Mapped controls, click Link a control, pick a framework, tick the controls and click Link control.
- Click the X on a directly linked control to unlink it.
- In Configure, choose an Owner, set a Renewal date and click Save, or click Clear renewal date so it never expires.
- Click Delete, then Confirm delete, to remove the artifact, its links and the stored file.
Rules that apply
- A control link that came from a passing check carries a lock icon and cannot be removed here. Link the same control directly if you want it under your own control.
- A renewal date in the past marks the artifact Needs renewal at once. A future date marks it Ready again.
- Clearing the date means the artifact never expires.
- An owner has to be an active member of your organisation.
- Deleting is final. The artifact, its control links and the stored file all go.
Keep evidence freshLive
Make evidence age honestly, so a control cannot stay green on a document nobody has looked at in a year.
As a member
- Read the Status column and the tiles on the Evidence page. Ready is inside its window, Upcoming renewal expires within 30 days, Needs renewal has already expired.
- Open an artifact and read Freshness history, which plots Captured, Renewed and Expired events by month across the last year.
- Upload the document again, or add the same URL again, to start a new window.
As an admin
- Same as a member, plus you can move the date. Open the artifact, set a new Renewal date and click Save, or click Clear renewal date so it stops expiring.
Rules that apply
- The sweep runs every hour. Nothing waits for a person to notice.
- Expired evidence scores zero. Every control leaning on it loses that part of its readiness.
- A passing run of the check that produced an artifact renews it. An identical result renews the same artifact instead of piling up a new one.
- An artifact with no renewal date never expires.
Ask a colleague for evidenceLive
Track who owes which proof and by when. The proof itself still arrives through the normal upload.
As a member
- On the Evidence page, scroll to Evidence requests. Each one shows its title, the control it belongs to, who it is assigned to, the due date and a status pill.
- When an admin assigns you one, an inbox notification "Evidence requested" arrives with a link to it.
- On a request assigned to you, click Upload, choose the file, then click Upload & fulfill. The file is mapped to the request's control and the request closes.
- Or click Fulfilled to close it without attaching anything here.
- The same card sits on a control page as Evidence requests, where the ones assigned to you carry a You tag.
As an admin
- Fill in What's needed, Assign to and Due date, then click Request.
- Create it from the control page when it belongs to a control. A request made on the Evidence page carries no control.
- Open Reusable templates to add a template with a name and a cadence, then click Use to spin a request from it.
- On any open request, click the X to cancel it or the trash icon to delete it. You can fulfil any request, not only your own.
Rules that apply
- A due date in the past shows overdue in red. Nothing chases it beyond the notification digest.
- Fulfilling is a flag. Nothing links the request to the artifact that satisfied it.
- Template cadence is a label. Nothing creates a recurring request from it.
- A member can only fulfil a request assigned to them. Anything else is refused.
- An approver sees Upload and Fulfilled but the status change is refused. The file lands and the message reads "Evidence uploaded, but the request could not be marked fulfilled".
The older Tests pagePartial
An earlier results view that Monitoring replaced. It is not in the menu, but the dashboard Quick Start step Run continuous tests still links to it.
As a member
- Do not press Run tests on this page. As a member the request is refused and you are signed out on your next click.
- Read the donut and the tiles if you land here, then go to Monitoring, which shows the same results with filters, findings and history.
As an admin
- Run tests works and queues a run for the whole organisation.
- The page says "Queued!" whatever the answer was, so confirm on the Monitoring run bar.
Rules that apply
- Only enabled checks are listed.
- Everything here is on Monitoring, in more detail.